Elliott wave analysis reveals not only what’s going on with the stock price of a well-known company but what may lie ahead for the global economy. Our May Global Rates & Money Flows gets into the nitty-gritty:
Honeywell International Inc., the iconic multinational industrial conglomerate, is a good gauge to look at when assessing the global economy. Like so many other companies it is being impacted by the nascent trade war and imposition of tariffs. We showed this chart in May last year when we noted the textbook triangle pattern from 2021 to 2024:
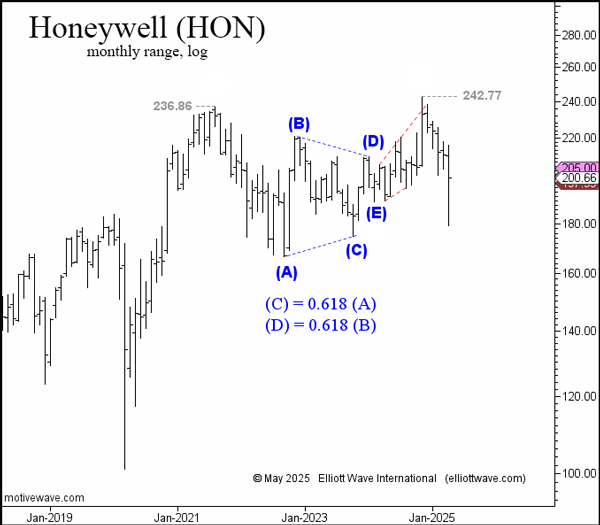
The internal ratios of the pattern, with wave (C) equaling 0.618 the length of wave (A) and wave (D) equaling 0.618 of wave (B), increased the probability that the pattern identification was correct. Due to triangle patterns appearing in only certain places under the Elliott Wave Principle, we stated at the time:
“…we can anticipate a thrust higher in what should be a terminal advance.”
That thrust higher occurred and propelled the price above $236.86. The sharp decline from $242.77 [means] a very significant peak in the Honeywell share price is probably in place.
This is extra evidence that the global economy is likely on the cusp of contraction.
Yes, there are other signs that the worldwide economy is on the brink of a recession. Our Global Rates & Money Flows explains why the next financial crisis could make 2008 look like a tea party – the Boston Tea Party! Prepare now by clicking on the button below.
Not ready for a full subscription? Get only the May issue of Global Rates & Money Flows by following this link.