Welcome Followers of Nishant Kumar
Thank you for submitting your questions! Asian-Pacific Financial Forecast Editor Mark Galasiewski recorded the answers for you in the video below – enjoy! P.S. Don’t miss your limited-time bundle offers below the video to get Mark’s Indian market forecasts and practical Elliott wave trader education at a deep discount.
Hey investors, Mark Galasiewski here. I’d like to extend a special welcome to followers of Nishant Kumar.
Thank you for sending in your questions. Let’s get started.
Q&A with Mark Galasiewski, Elliott Wave International’s
Chief Equity Analyst for Asian-Pacific and Emerging Markets
- In April 2009, you shared with the Economic Times and CNBC TV-18 a 15-year forecast of Sensex at 100,000 in 2024, which you re-iterated in April 2016. (See http://tinyurl.com/4n4ycyy8.) Is that view still valid in 2024?

Our Sensex 100,000 forecast was always a functional or working target, which means that it could be subject to revisions along the way—like any forecast made according to the Wave Principle. But it has served its purpose over the years, which has been to keep everyone’s eyes focused on the extent of the massive bull market in India that we expected would follow the global financial crisis of 2008. The Sensex may need one or two years beyond April 2024 to reach 100,000, but I think it has a good chance of reaching the target by the end of the bull market that started in 2020.
- What is Elliott Wave International’s wave count for Indian stocks?

The Sensex probably began a Supercycle advance in the 1970s and our 100,000 target was for the end of Cycle wave III of that advance, which began at the 2003 low. We believe that the index began Primary wave ((5)) of Cycle wave III at the 2020 low, but there are other possibilities. For example, the alternate count shows that the 2018-2020 correction may have only been a second wave of Intermediate degree. But, for now, the only wave count that matters is the developing five-wave advance from 2020, which is not yet complete.
3. What’s your take on how geopolitical events are shaping the trajectory of Indian stocks? Given the ever-changing landscape in the Asian region and emerging markets, how do you navigate these influences when assessing future trends?

Geopolitical events have never shaped the trajectory of stocks in India or any other market. Rather, the natural fluctuations in social mood that have driven the waves in global stock markets have shaped the trajectory of geopolitical events.
Major geopolitical crises tend to occur every several years—mostly because global bear markets tend to occur every several years. To conventional observers, the global financial crisis of 2008 was caused by a property bust and the global stock market collapse of 2020 was caused by a pandemic. But, from our perspective, in Indian stocks the 2008 correction was just a large second wave and the 2020 correction was the end of a large fourth wave. That becomes especially clear when we consider the patterns in higher-beta indexes such as the Nifty Consumption Index, whose Primary wave ((4)) correction was more pronounced than that in the Nifty.
The job of an Elliott wave analyst is first to predict the waves—which is difficult enough to do with any consistency as it is. Predicting the geopolitical or other mass social events that will coincide with those waves is effectively impossible. But if you know, first, to expect boom and bust and, second, to expect the kind of events that will occur during each trend—that is, positive in bulls and negative in bears—then you will be far better prepared to survive and even thrive in both environments.
4. What is your view on the global metals and mining sector and emerging markets?

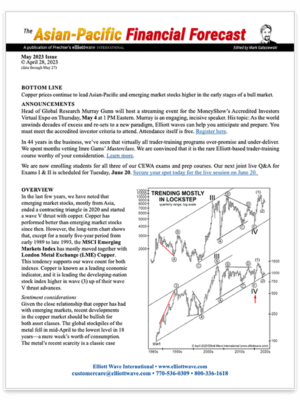
The long-term chart of copper offers a great background for discussing emerging market stocks, since the two asset classes have tended to ebb and flow together for decades. This chart shows that we believe the large contracting triangle patterns from about 2007 to 2020 in copper and the MSCI Emerging Markets Index to be large-degree fourth waves. Since 2020, the two indexes are tracing out a series of first and second waves in what should be a much larger advance. Because copper is considered a leading indicator, it’s positive for both asset classes that the metal appears to be leading the stock index at present. Metals and mining companies and commodity producers in general contribute significantly to emerging market economies, so we see a bright future ahead for both asset classes.
This chart also makes an interesting point about the relationship between global stock markets and geopolitical events. From a socionomic perspective, we believe that Hamas’ attack on Israel in October 2023 played a role very similar to Al Qaeda’s attack on the United States on 9/11—that is, as an expression of the extreme negative mood in emerging markets toward the end of a secular bear market near the MSCI Index’s lower channel line.
5. Cryptocurrencies and equities appear to be trending together. What is your outlook for bitcoin?

Yes, Elliott Wave International believes that bitcoin’s advance is simply another expression of the psychology of the bull market from 2008. It has tracked infotech indexes, such as the MSCI Emerging Markets Asia Infotech Index, particularly well. Our wave count at present assumes that both bitcoin and the global infotech sector will eventually hit record highs as they trace out fifth and final waves up in their bull markets.
Thank you for watching, everyone.
To stay in tune with the latest analysis, I invite you to check out our Asian-Pacific Financial Forecast Service for Indian markets.
EWI’s marketing team has put together two special offers exclusively for followers of Nishant. Look for details below this video.
YOUR LIMITED-TIME OFFER
Keeps you ahead of waves in the Nifty, Sensex and Gold
Teaches you Elliott wave trading skills you can use for a lifetime
Every Month
At the beginning of each month, you get a 30-60 day look ahead at the Nifty and Sensex from editor Mark Galasiewski. With insightful charts and text, the Asian-Pacific Financial Forecast (India) lays out expected trends and turns. Plus, insights into psychology driving waves in the region.
3 Days Per Week
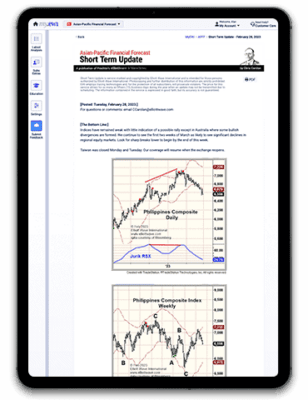
Before the markets open on Monday, Wednesday and Friday you get the Asian-Pacific Short-Term Update (India), edited by Chris Carolan, alerting you to what’s changed and what’s upcoming for the Nifty in the next several days. (They are published by 6pm ET on Tuesday, Thursday and Sunday in the United States)

Special Gold Report
This special report shows you why there’s a better way to forecast gold prices and reveals what we expect from the precious metal in the weeks and months ahead.
Choose Your Package
You have two custom packages to choose from — each package includes the resources listed above plus you get to select the Elliott wave trader education bundle that’s right for you. The courses in these bundles were hand-selected by Nishant Kumar to fast-track your wave trading journey. Take your pick…
GOOD DEAL
Beginner’s Bundle
- 1 year of our Asian-Pacific Financial Forecast Combo — India ($149 value)
- The Elliott Wave Gold Report ($29 value)
- Elliott Wave Trading Beginner’s Bundle:
3 practical courses to help you learn and apply the Wave Principle to your trading ($227 value)
More Info…
Total value: $405
$149
BEST DEAL
Pro Bundle
- 2 years of our Asian-Pacific Financial Forecast Combo — India ($298 value)
- The Elliott Wave Gold Report ($29 value)
- Elliott Wave Trading Pro Bundle:
6 hand-selected courses to get you beyond the basics and help you maximize your trade plan — like an Elliott wave pro ($524 value)
More info…
That’s a total package worth $752!
$249