These “before” and “after” charts of Solana show you when the recent uptrend began & whether the “f’in” excitement will continue
Move over Bitcoin, there’s a new crypto sheriff in town: Solana. What did the coin do to earn its star-shaped badge? In the morning hours of November 2, Solana soared to its highest level in 14 months after clocking an 80% gain for October alone.
Enthusiasm for the coin went bull-istic, and news of Solana’s surge did the unthinkable: it made the big-kid pants’ press from Forbes — “Solana Prices Climbed More than 80% in Under a Month” — to Bloomberg — “Solana is Now Year’s Best Performing Large Token.”
One former crypto influencer expressed his enthusiasm for Solana in an expletive-heavy tweet on November 2, saying:
“Fam I have something embarrassing I must admit. I just bought SOL. I know it’s a Sam-coin piece of dogsh** that at this point is just a meme. But it is going up, and I’m a degen. Let’s F**’in Go!”
There’s no reading between those lines.
What caused Solana’s surge?
Yahoo Finance on November 2 drew a line between the coin’s rally and several bullish events, writing:
“The soaring price follows a series of announcements Solana-based developers and teams have made at the blockchain’s Breakpoint conference in Amsterdam. The event started Oct. 30 and ends Nov. 3.
“Adding to the rising optimism around the token is a recent report [on Oct. 27] by VanEck. The investment firm predicts that by 2030 SOL could reach $3,211, outshining anticipated returns from Ethereum.”
But this line of reasoning doesn’t extend back far enough. Solana’s recent unstoppable rally didn’t begin in late October. It began a month earlier, in early September.
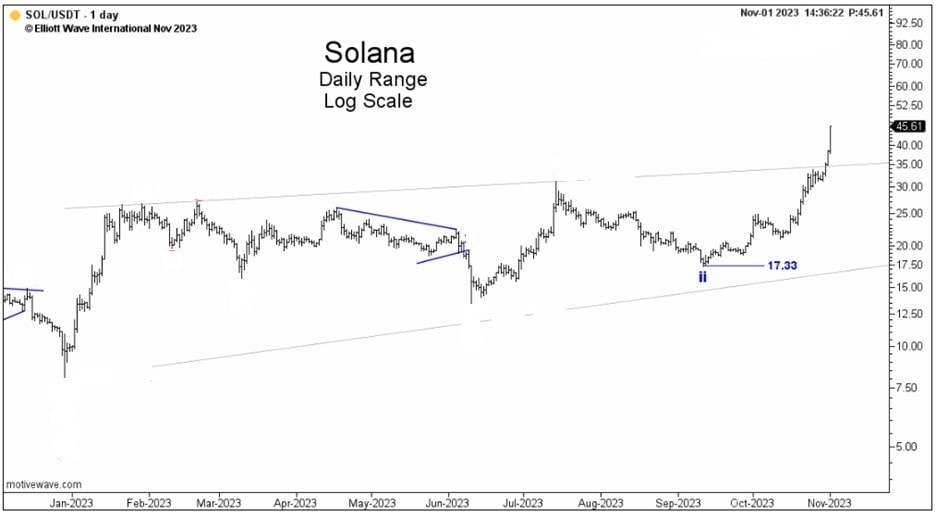
Then on September 10, our Crypto Pro Service daily coverage of Solana showed this pair of labeled price charts. Both pictures told the same story: Solana’s downtrend underway since mid-July was a second-wave pullback, which was nearing its end. From the September 10 Crypto Pro Service:
“We’re now looking lower, with a minimum expected low at 17.57, where it would equal the length of wave 1.”
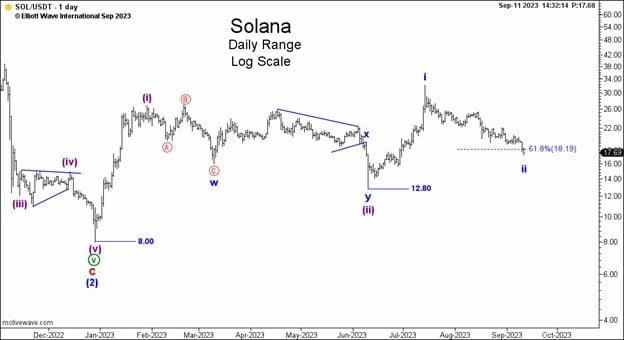
Solana would bottom at 17.33 on September 11.
Then, on Sept 14 Crypto Pro Service confirmed the wave ii bottom was in place “with the overlap of the 19.02 key level.” This set the Elliott wave stage for a powerful third wave advance.
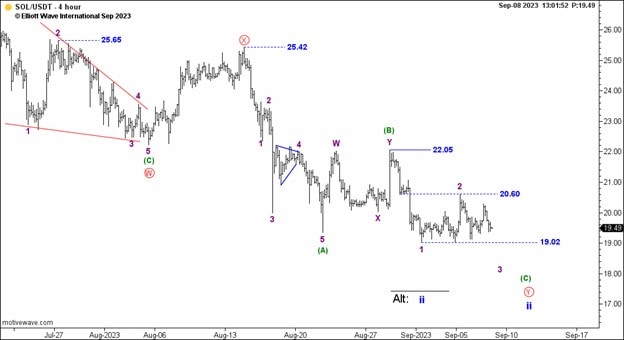
And, this next chart captures Solana’s upsurge into the November 2 high, marking a 170% gain from its September 11 low.
Note, on November 2, our Crypto Pro Service warned the coin’s “unstoppable” rally may meet some near-term resistance:
“While further highs are possible to 49.31, I think we need to be cautious about an approaching high and reversal. Upside momentum is deep into overbought territory, which is a red flag.”
From there, Solana turned down in a 15% decline to end the day on November 2.
Cryptocurrencies are extremely volatile. The coin wearing the sheriff badge is constantly changing. And while no forecasting model can predict price turns with total accuracy, Elliott wave analysis does stand apart in its ability to identify key price levels to help minimize the inherent risk involved in trading these markets.
And, starting Sunday November 5, our Crypto Pro Service will debut new, intraday coverage of Solana as part of its roster of market analysis.
Cryptocurrencies: Learn to Be in the Driver’s Seat to Opportunity
Right now, Crypto Pro Service presents detailed video lessons on potential opportunities underway in Bitcoin, Litecoin, Ethereum, XRP, Polkadot, Solana, and more!
Subscribe today and discover why capitalizing on crypto trends is less about being intrepid and more about being prepared and independent.
See below for instant access to new crypto forecasts now.