This survey just reached its most extreme since August 2021
The extent of today’s upbeat mood toward the U.S. stock market is captured in these two headlines:
- Wall Street’s Stock-Market Optimism Isn’t Stopping (Wall Street Journal, Dec. 20)
- American households are invested in the stock market like never before. … (Marketwatch, Dec. 22)
This goes way beyond the typically positive bias around the holiday season. It’s much closer to optimism on steroids.
Indeed, our Dec. 20 U.S. Short Term Update, a publication which provides near-term forecasts for key U.S. financial markets, discussed two specific sentiment gauges. Here’s the first chart along with the associated commentary:
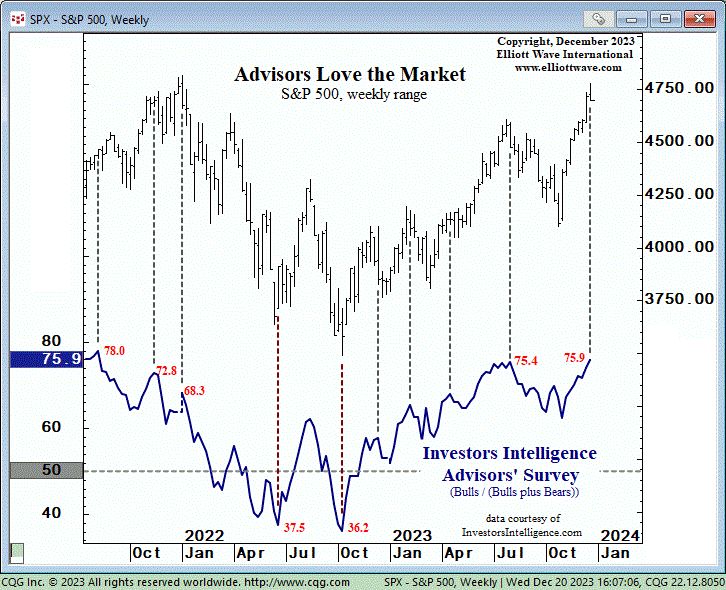
The Bullish Percent in the weekly Investors Intelligence Advisors’ Survey is 75.9%, the most extreme since August 2021.
This second chart – along with comments — reveal another extreme.
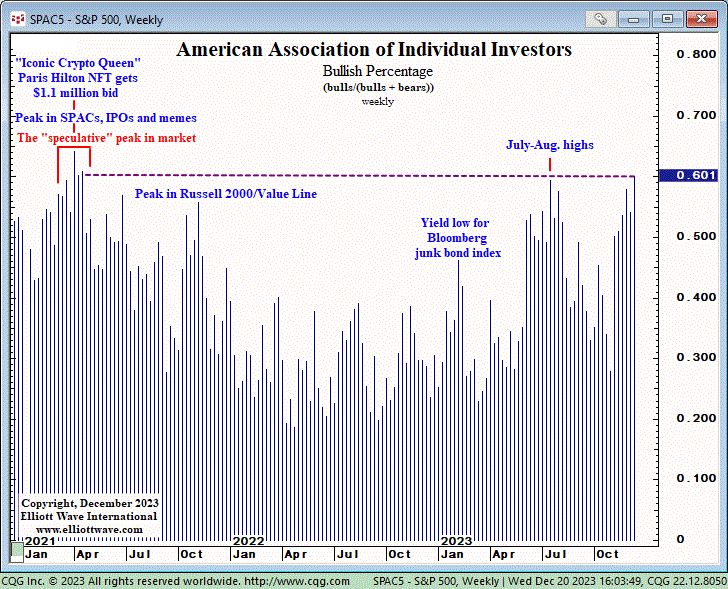
The Bullish Percent in the weekly American Association of Individual Investors poll is 60.14%, the most extreme since April 2021, which coincided with the peak in SPACs, meme stocks, IPOs and the front edge of the top in the craze for electric vehicle stocks.
Also be aware that the Dow’s RSI (Relative Strength Index) closed on Dec. 19 at 86.86, the highest level since January 2018.
And here’s another item – this one from our Dec. 22 U.S. Short Term Update:
The Exposure Index compiled by the National Association of Active Investment Managers … represents the average exposure to U.S. equities reported by the organization’s members, who are active money managers. At 97.32%, active managers are essentially fully invested in stocks.
This brief review of just a few sentiment gauges only scratches the surface of what we are currently examining.
Our technical analysis of the market – including, of course, Elliott wave analysis – is another factor that we believe you’ll want to consider as you make decisions about your portfolio.
Get the in-depth insights that will help you plan your financial future by following the link below.
Get Near-Term Forecasts for Key U.S. Financial Markets
Our U.S. Short Term Update offers in-depth near-term analysis of the major U.S. stock market indexes, as well as bonds, gold, silver, the U.S. Dollar and more.
This thrice weekly publication is part of our flagship Financial Forecast Service – alongside The Elliott Wave Theorist and The Elliott Wave Financial Forecast, which are both published monthly. Thus, you get our total financial outlook for U.S. markets, meaning near-, intermediate- and long-term analysis.
Prepare now for 2024 by following the link below.