Our charts put gold’s recent rally into a different perspective, one independent of the Israel-Hamas conflict.
(Editor’s Note: This article is published with deep consideration and sensitivity to the ongoing Middle East war and human toll it continues to take.)
Halloween may be a week away, but the combined colors of orange and black — i.e., gold — are front and center in the world of finance as the precious metal king spends October soaring. On October 20, gold came within $4 per ounce of the $2000 level, tapping its highest price in five months.
According to the mainstream pundits, as shown by these recent news items, the Israel-Hamas war is the spark that lit gold’s October surge:
- Gold price today: Rates jump on Israel-Hamas war escalation fears; what should be your strategy for bullion today? (Oct. 18 Livemint)
- Gold price recaptures five-month high as Middle East tensions escalate (Oct. 20 FX Street)
- Gold price rises to 11-week high on escalating Middle East conflict (Oct. 18 Mining.com)
- Safe-haven gold rallies over 3% as Middle East conflict intensifies (Oct. 13 Reuters)
- Mideast turmoil pushes safe-haven gold closer to key $2,000/oz level (Oct. 20 Yahoo)
But this logic is problematic. Gold’s recent uptrend began before the Israel-Hamas conflict. A rise in “safe haven” demand makes sense as an explanation for gold’s rally — after the fact. But not before.
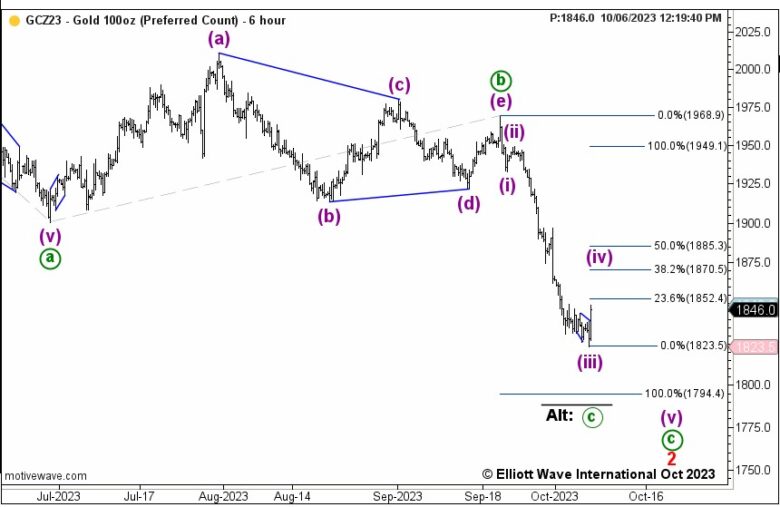
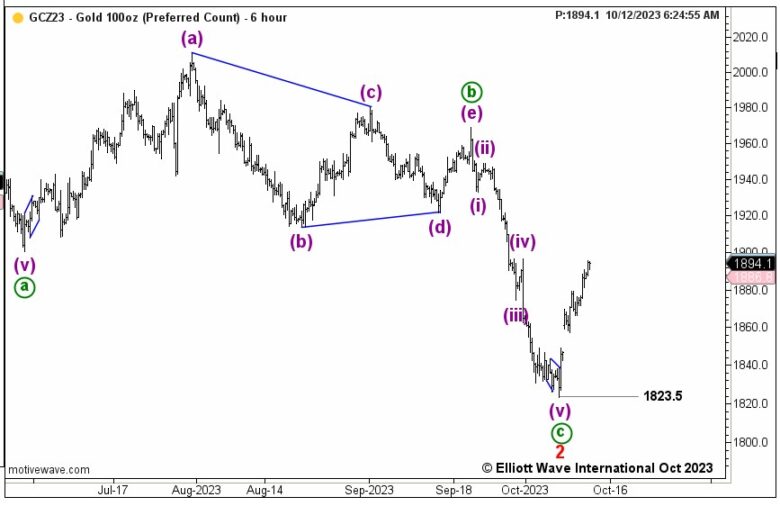
On October 6, one day before the Hamas attack, our Metals Pro Service showed this labeled price chart of gold. The primary Elliott wave count called for a fourth wave rebound, followed by a deep selloff in wave five. However, this count, like all Elliott wave interpretations, identified a clear price resistance level that would move the alternate, much more bullish labeling for gold to the foreground. Here is an excerpt from Metals Pro Service, Oct. 6:
“Pushing above 1885.30 would be excessive for a fourth wave and call for re-evaluating the pattern. Wave c (circled) could be complete at the current low.”
On October 9, after a turn up in gold, Metals Pro Service explained how the “sharp rise raises concerns a bottom has already formed at 1823.50,” and said that “a push above 1900 would make a more bullish view compelling.”
On October 12, Metals Pro Service had the price confirmation it needed to solve the near-term picture and said:
“Gold exceeded reasonable limits of a fourth-wave correction and I am adopting the bullish view that wave c (circled) bottomed at 1823.50. That would make the current rise wave (i).”
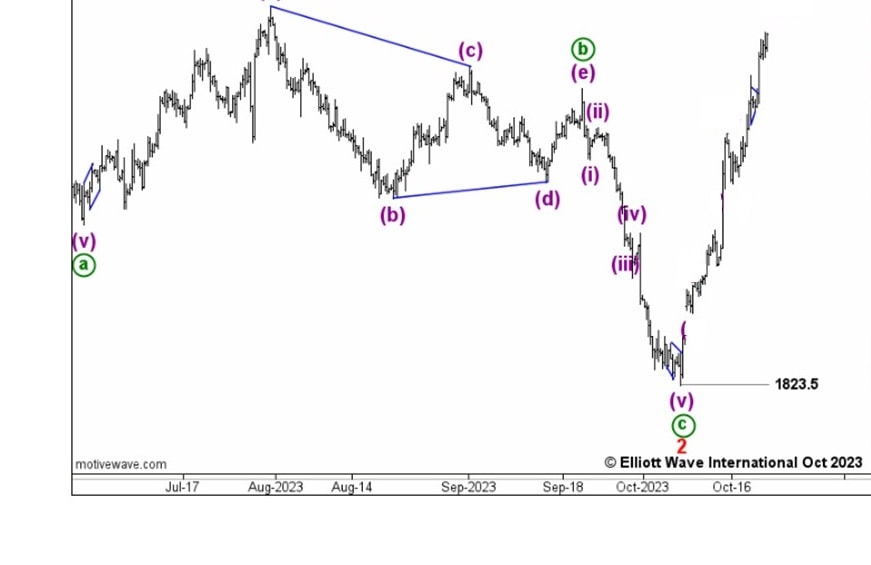
And this final chart captures the extent of gold’s October rally thus far:
“Fundamental” analysis will always play catch up with major price turns. Meanwhile, while far from perfect, Elliott wave analysis often positions investors and traders in front of those turns, providing critical support and resistance levels to help manage risk.
Precious Objectivity into Precious Metals
Before the October rally in gold, our Metals Pro Service was ready. For active traders watching the intraday, daily and weekly movements, this service presents detailed analysis from intraday to longer time frames, focusing on meaningful developments underway in gold, silver — as well as copper, platinum, and more.
Go from following market trends to falling in line with their objective paths of least resistance.
Make Metals Pro Service a part of your financial toolkit today!