Here’s what happened with crude oil prices after the landfall of Hurricane Katrina
History shows that investors have frequently been surprised by the direction of crude-oil prices.
The main reason why is that they presume the price of crude will go up if there’s a disruption in supply or an increase in demand — or go down if there’s a supply glut and a decrease in demand.
Yes, sometimes crude prices do rise when, say, there’s a supply disruption (or vice versa). The point is: Investors cannot count it.
This Aug. 2 headline from Seeking Alpha is an example of what I’m talking about:
Oil prices plummet despite huge drop in crude inventories; risk-off sentiment rules
We’ve seen many other headlines in the past where the price direction of crude oil did not follow what was expected from supply \ demand factors.
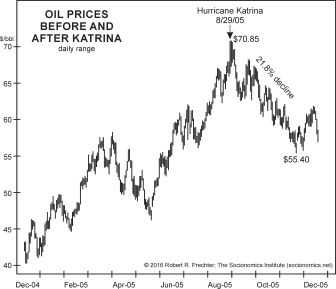
I mentioned history a moment ago. In 2005, Hurricane Katrina shut down 95% of crude production in the Gulf of Mexico, which amounted to a quarter of total U.S. output.
This chart from Robert Prechter’s landmark book, The Socionomic Theory of Finance, shows what happened next with the price of crude:

As you can see, after Hurricane Katrina made landfall, the price of crude slid more than 20% in the next three months. This major disruption in the supply of crude oil did not make oil prices skyrocket, as many investors might expect.
Elliott Wave International posits that the Elliott wave model offers investors more predictive utility versus the supply / demand model.
Chapter 22 of The Socionomic Theory of Finance makes that case by reviewing our past crude oil forecasts.
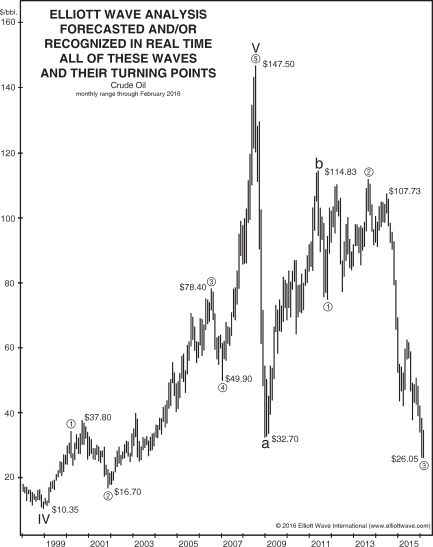
Another chart from the book is a summing up and the title says it all:

The chart displays the extreme prices associated with EWI’s oil-market calls since 1993 and until the time that The Socionomic Theory of Finance published.
Here’s what you need to know: Our monthly Global Market Perspective uses the Elliott wave model to forecast crude oil’s price direction now. You’ll find those crude-oil forecasts in the publication’s “Energy” section.
Follow the link below to learn how you can access these crude-oil forecasts, as well as our outlook for global stock markets (including in the U.S.), bonds, metals, cryptocurrencies, forex and much more.
The Same Patterns of Investor Psychology Span the Globe
Investors in Japan behave like investors in Great Britain.
Likewise, chart patterns of widely traded U.S. financial markets unfold in similar ways to those in France, Australia, South Korea, India and other nations.
You get the idea: Elliott wave analysis works in any widely traded financial market around the world.
The classic Wall Street book Elliott Wave Principle, says:
[The] Wave Principle often indicates in advance the relative magnitude of the next period of market progress or regress.
Learn our forecasts for 50+ global markets in the just-published August Global Market Perspective.
Click on the link below to learn more.