On March 25, the king of crypto trading platforms Coinbase Global Inc. (Nasdaq: COIN) soared to its highest level since December 2021. This prompted a series of what goes up must stay up news stories regarding COIN’s future. From Yahoo Finance, March 29:
Coinbase’s journey (as well as crypto’s) has been nothing short of historic and shows no sign of slowing down. As the cryptocurrency asset class continues to evolve, Coinbase’s future looks increasingly bright.
Projecting what a company will look like in the next decade is inherently speculative, especially when its business model depends on new technology. To introduce some objectivity, I’ll examine some data and financials since numbers don’t lie.
That depends on what numbers, because quite frequently, the truth in “fundamental” numbers to determine a market’s fate has been iffy.
For instance, at the start of 2024, the big number to come out of the crypto sector was 11. Specifically, on Jan. 10, the Securities and Exchange Commission greenlit the launch of 11 Bitcoin exchange traded funds (ETFs). That number was supposed to turbo boost COIN interest and increase the positive number on bulls’ portfolios.
Instead, these news items from the time tell the story of what happened:
Motley Fool, Feb. 5:
COIN down 26% in January… Conventional wisdom said that if a Bitcoin ETF were approved, this would create plenty of new demand for the cryptocurrency, sending the price higher.
And, Barron’s, Feb. 5:
Bitcoin ETFs Are Turning Into a Drag for Coinbase Inc. The ETFs launched to much fanfare in January, yet average daily spot trading volume on Coinbase has fallen to $1.9 billion from $2.5 billion in the 30 days preceding their launch.
Also, Investor Place on Feb. 8 explained how another set of numbers – “unexciting financial results” recommended COIN to a shortlist of “sorry financial stocks to sell in February while you still can.”
But the future of COIN depended then (and now depends) on a very different set of numbers and letters – that of Elliott wave analysis. On February 8, our Crypto Junctures service presented an Elliott wave labeled price chart of COIN which showed prices at the end of a circled wave b decline. The next move was clear: A c wave rally to multi-year highs. From Crypto Junctures on Feb 8:
If we can get a nice impulsive rally above 170, that would be an early sign of the probability of a low for wave B. Looking ahead, wave c is set to exceed the extreme of wave A… possibly in the 245-5- range.
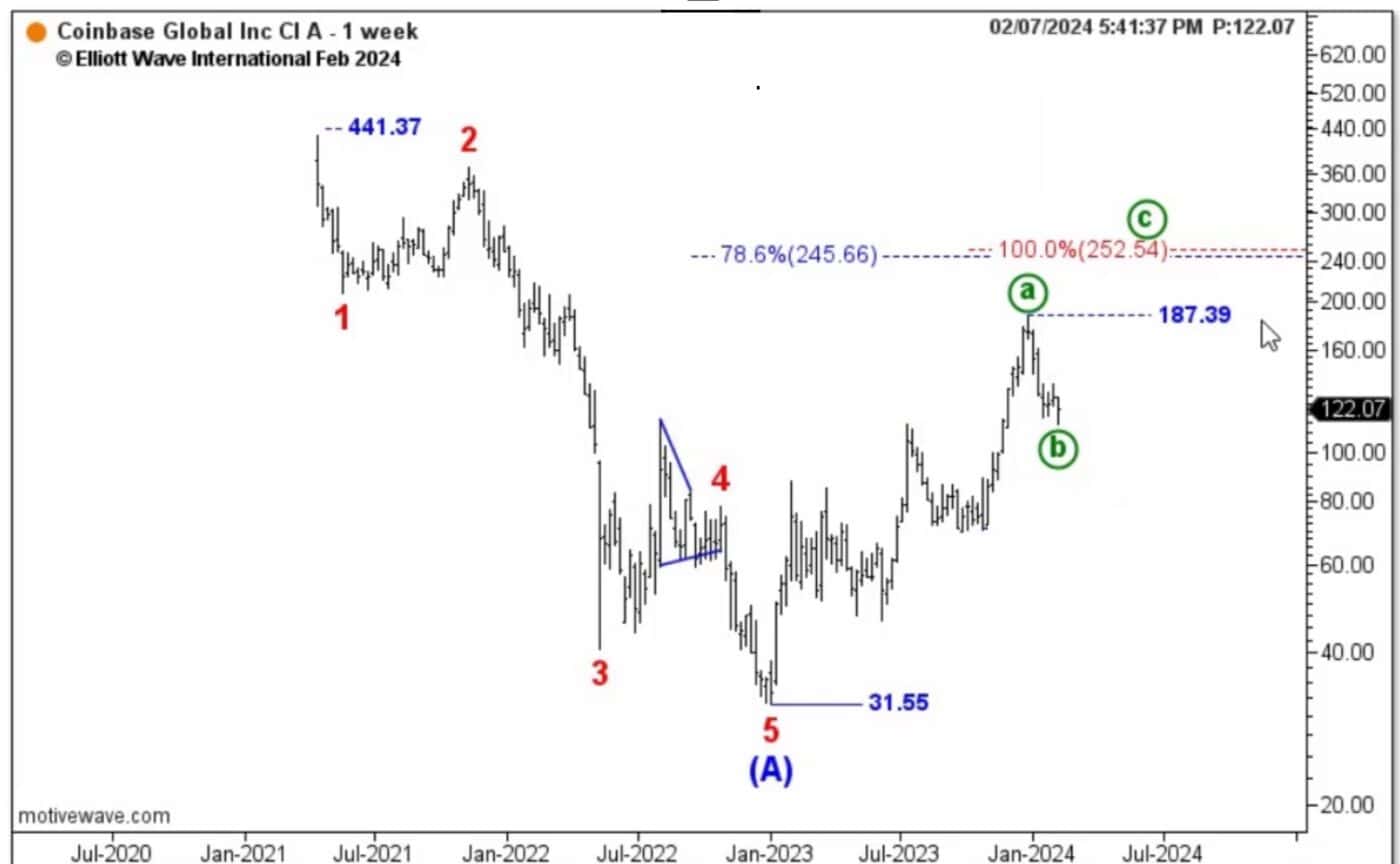
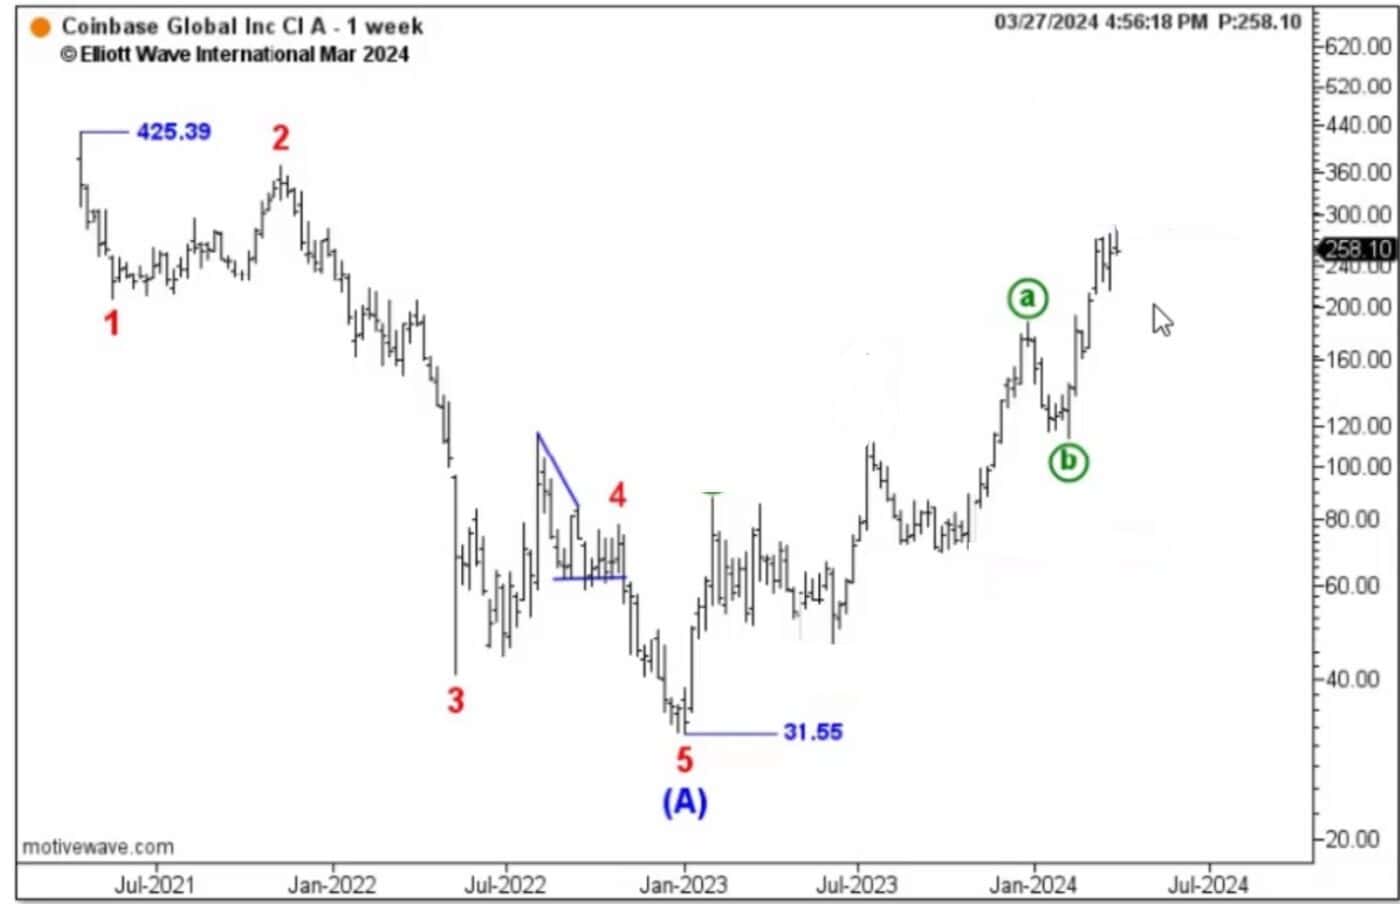
And from there, COIN set sail, rising to a 3-year high on March 25. On March 28, Crypto Junctures revisited COIN to generate a fresh wave count. There, we captured the stock’s powerful wave C rally (pictured below), and identified the exact price level to watch that, if breached, would be investors’ “final warning to take some money off the table.”
At the end of the day, every investor has two goals: Arrive at potential set-ups early and leave before it’s too late. Achieving both goals is a numbers game… the numbers and letters unfolding as Elliott wave patterns in Crypto Junctures service.
Trading Lessons (Plus, Market Opportunities): 2 for 1
At least 3 times a week, press “Play” and watch one of our 2 experienced analysts explain in comprehensive detail how to recognize the relevant Elliott wave patterns (and supporting technical indicators) underway now and in the future of the world’s leading cryptocurrency stocks.
This is every Crypto Junctures video in a nutshell: a lesson, often with a new opportunity in a wide swath of markets from individual stocks, cryptocurrencies, commodities, and more.
Here’s how to watch the latest lessons now.