Yes, sometimes traders do have a way to catch the market’s exact top or bottom.
Anyone who knows me knows I’m a cat lover. Some might go so far as to call me a crazy cat lady. My cats would call that a “them problem.”
One of the countlessly cool traits of the domesticated feline is their ability to always land on their feet after falling. (Well, most of them anyway!) In fact, the higher the point from which a cat falls, the greater chances it’ll stick that all-fours landing as it has longer to right itself.
Name the trader who wouldn’t give anything for that skill.
By nature, falling is an inevitability when it comes to negotiating the slippery ledges of financial markets. But the reason traders so often fail to land on their feet isn’t a lack of dexterity. It’s because the ground beneath them is constantly changing – at least, the “fundamental” ground.
Take, for instance, the Big Board beast Caterpillar, Inc. (ticker symbol: CAT). The world’s largest construction-equipment maker is a keystone stock, as cash-strapped builders don’t pull permits. In other words, the health of construction companies reflects the overall health of the economy.
Wall Street notices CAT. And late last October, they noticed CAT falling to its lowest level in 4-and-a-half months.
As for the stock’s future, traders who leapt into the market found themselves falling toward an ever-shifting “fundamental” ground below. First, bullish experts said CAT’s selloff was “misguided” (CNBC, Oct. 31) and pointed to a slew of positive data set to keep the wind at its back. Wrote Investopedia on October 31:
“Caterpillar Shares Fall on Economic Concerns, Despite Earnings Beat. The stock is now in negative territory for the year and down from an all-time high of almost $290 per share at the start of August.”
But Investor’s Business Daily on October 28 pointed to a different set of numbers that spelled trouble for CAT. It wrote:
“Caterpillar, These S&P 500 Construction Stocks Tumble On Peak Demand Fears. This is the Trigger. CAT falls to its lowest since early June after the company said its order backlog shrank in the third quarter, a sign the market sees as slowing demand for its iconic yellow machinery.”
Even the most acrobatic housecat couldn’t land upright on that inconsistent ground.
Fortunately, there was a more stable alternative: On November 16, our Trader’s Classroom presented a labeled price chart of CAT. The Elliott wave structure was clear: A second wave retracement was complete, opening the door for a third wave rebound. From the November 16 Trader’s Classroom:
“ I think we’re in a bullish period in the overall market. As long as that last low holds 233.57, it’s clearly a three-wave rally so far, and I would view this as a developing impulsive rally.”
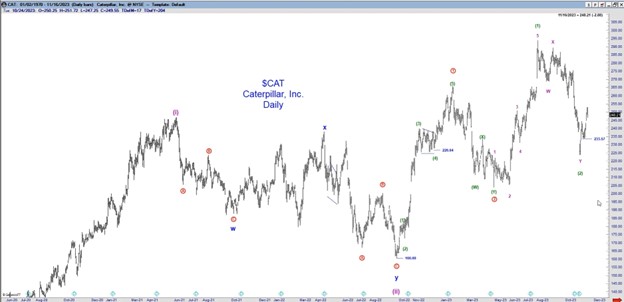
From there, CAT took off to the upside like a cat on a hot tin roof. On January 17, Trader’s Classroom revisited the stock to assess the impulsive move. From our archive:
Here’s Caterpillar. This count is aggressively bullish with the series of 1-2, 1-2, 1-2. Each pullback has overlapped the previous high. It should work higher. I would say as long as CAT holds 38% of this third wave at 273.63, it’s in good shape to go higher.”
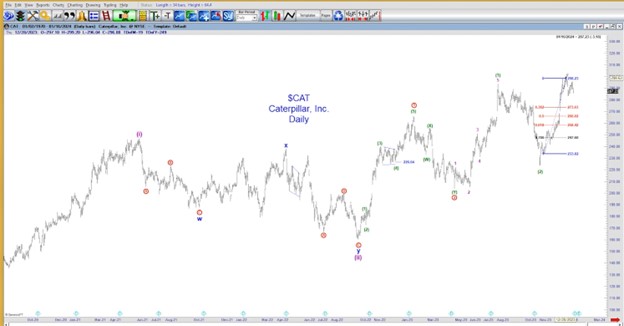
Once again, CAT continued upward. On March 7, Trader’s Classroom drew CAT in close to evaluate the trend. We wrote:
“Caterpillar had a whole bunch of 1-2’s, and it’s actually delivered. If it were to pull back, I would expect it to bottom between or above these levels (297.04-283.05) and then go right back up to new highs in a series of 4, 5’s on the upside.”
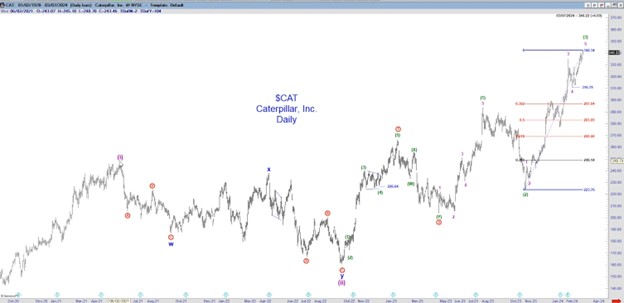
CAT never pulled back, in fact, soaring to the highest level in its 95-year trading history on April 4 before slackening.
As I said. Falling is inevitable in trading. Elliott wave analysis doesn’t remove risk; it manages it by identifying critical price levels that help traders right themselves before landing on the ground below. And that’s the cat’s meow!
Trading Lessons (Plus, Market Opportunities): 2 for 1
3 times a week, press “Play” and watch one of our 6 experienced analysts explain in comprehensive detail how to recognize the relevant Elliott wave patterns (and supporting technical indicators) underway now and in the future.
This is every Trader’s Classroom video in a nutshell: a lesson, often with a new opportunity in a wide swath of markets from individual stocks, cryptocurrencies, commodities, and more.
Here’s how to watch the latest video lessons now.