After the March 10 bank runs began, Bitcoin seemed prime for freefall. But Elliott waves said bulls would have their day once more. Here’s why.
The other weekend, extreme weather hit my hometown. Tornadoes barreled through the center of the city, tossing giant tree branches and commercial building roofs into the streets. And just when the worst of the storm seemed to taper, a violent bolt of lightning struck the ground of our property. Electricity jumped into the cable box on the side of the house, traveled through the wire inside the wall leaving a charred black line along its path until hitting a surge protector and exploding out through the router shattering into singed smithereens.
My family and I, sitting near the router at the time, leapt into the air and let out a collective stream of expletives as the lights in the house flickered and the noxious odor of burnt electrical wires wafted through the air.
After regaining our composure and letting our nerves settle, it occurred to us: This should never have happened if the cable wires were grounded.
Come to find out, we were right — they weren’t. The root systems of two hearty fig trees grown around the cable box had, over the years, lifted the grounding wire out from its post.
It goes without saying, it could’ve been much worse. We suffered a major shock and 4 days without internet service, so we count ourselves incredibly lucky.
But it made me think about the world of trading. More than not, active investors and traders approach forecasting without having a proper ground wire to protect them from sudden price shocks. The most popular model of forecasting, “fundamental” market analysis, is an open circuit that says news event “x” should cause prices to move in direction “y.” But it doesn’t provide calculated price objectives or prevent a wrong position from catching a spark and traveling the entire length of a portfolio when/if prices move opposite their expected path.
Take, for instance, the recent banking crisis which landed much like a bolt of lightning on the global financial landscape on March 10. That day, the FDIC announced the closure of crypto-friendly Silicon Valley Bank in the “largest bank failure since the global financial crisis.”
That’s the financial crisis of 2008, by the way — the biggest one this century.
Silicon’s collapse sent broader ripples, bringing down a domino line of financial institutions from Silvergate to First Republic, all heavily invested in frothier investments such as fintech and digital tokens.
In turn, crypto king Bitcoin crashed 10% on March 10 to 2-month lows. The crisis of confidence in crypto-backed banks seemed to portend further weakness in the sector. Here, these news items from the time echo this bearish “fundamental” outlook:
- “The digital assets industry is in the middle of a banking crisis with the collapse of crypto-friendly Silvergate Bank, and Crypto.com hasn’t been spared.” — March 10 CoinDesk
- “Crypto crash: Bitcoin, Ethereum, Dogecoin prices plummet after Silvergate Bank collapse” — March 10 Fast Company
- “Bitcoin plunges below $20k amid a 2008-like banking collapse” — March 10 Kitco
From CNBC on March 10:
“More than $70 billion wiped off crypto market in 24 hours as bitcoin drops below $20,000.
“There is just little reason to buy bitcoin now as the market is saturated with negative developments, not just specifically for the crypto industry, but also for the wider financial market as well.
“Overall, sentiment seems to have turned quite bearish given a combination of global macro and interest rate rises but also the exposure many banks probably have to long duration securities.”
“Fundamentally” speaking, bearish voltage doesn’t get any higher. From that standpoint, there did seem to be “little reason to buy bitcoin.”
But on March 8, our Crypto Trader’s Classroom presented a different picture for one of the largest bitcoin exchanges, bitcoin-tether (BTCSDT).
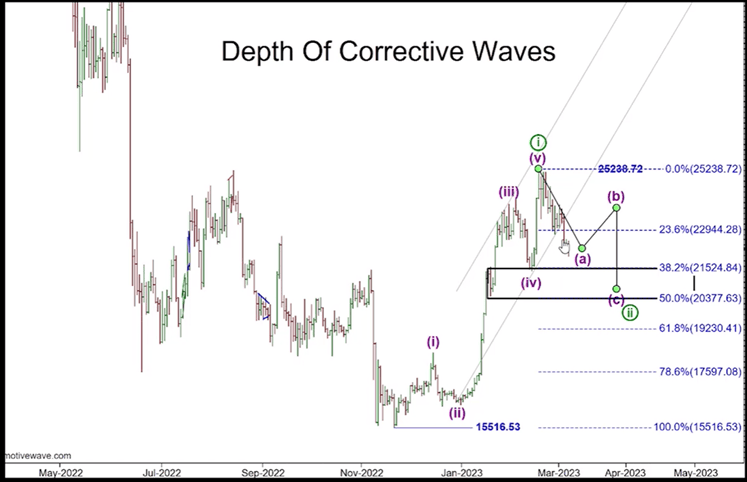
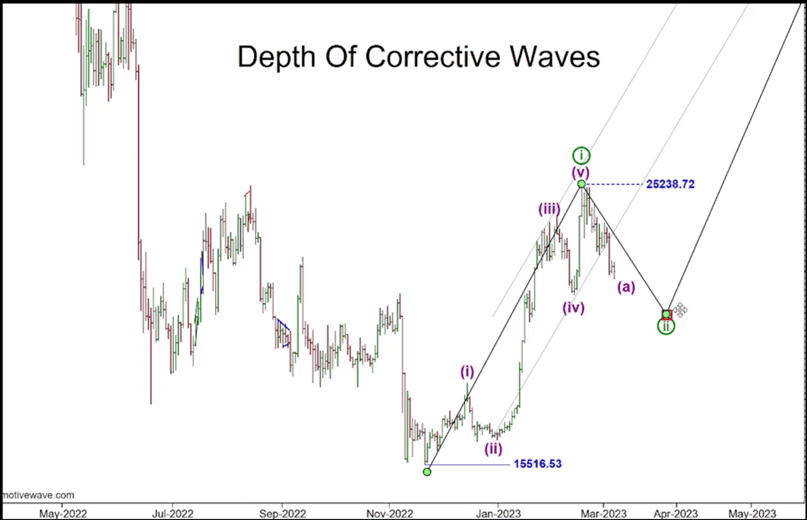
There, our analysis identified the crypto’s selloff as a wave 2 correction. Knowing this wave formation was key to assessing the market’s downside potential via an invaluable guideline of corrective waves.
From the encyclopedic Elliott Wave Principle — Key to Market Behavior:
“No market approach other than the Wave Principle gives a satisfactory answer to the question, ‘How far down can a bear market be expected to go?’
“The primary guideline is that corrections, especially when they themselves are fourth waves, tend to register their maximum retracement within the span of travel of the previous fourth wave of one lesser degree, most commonly near the level of its terminus.”
This guideline underscored the March 8 Crypto Trade’r’s Classroom’s outlook for bitcoin vs. tether. There, we identified high-potential downside targets for wave 2 on this chart:
“We can expect wave 2 to terminate somewhere between this wave 4 extreme of one less degree or two less degrees.”

The same Elliott wave model said that after bottoming, prices should stage a powerful wave 3 rally. From our March 8 Crypto Pro Service update:

And from there, BTCSDT declined into the cited target from our March 8 Crypto Pro Service update followed by a powerful rally to 9-month highs on March 29.
Whereas the bearish “fundamental” outlook for Bitcoin left traders without a back-up, this single Elliott wave guideline grounded them to a clear price window to watch for a potential reversal.
Of course, trading markets are risky, cryptocurrencies as well. And not all Elliott wave interpretations of price action work out. But Elliott wave analysis does provide objective rules and guidelines to help minimize risk no matter how big the shock.
Find out more about our Crypto Trader’s Classroom below.
Trading Lessons (+ Market Opportunities): 2 for 1
3 times a week, press “Play” and watch our team of instructors explain in comprehensive detail how to recognize the relevant Elliott wave patterns (and supporting technical indicators) underway now and in the future.
This is every Crypto Trader’s Classroom video in a nutshell: a lesson, often with a new opportunity.
Here’s how to watch the latest lessons now.
