Hello, and Happy New Year. The new issue of the European Financial Forecast is online, and there’s really just two things I want to highlight in this month’s letter.
The first is a chart showing a German version of what’s going on with the Magnificent 7. So in the U.S., we essentially have seven stocks that accounted for something like 95% of the gains in the S&P 500 last year. In Germany, we have a version of this where the largest five stocks in the DAX — okay, so this is Allianz, SAP, Siemens, Munich Re, Deutsche Telecom — these companies are up over 20% in two years while the DAX itself is up just 3%.
And there’s a price-only version of the DAX that’s down 4%. Large and Mid-Cap stocks are down about 10%. And the German BMI, which is essentially every sizable company that’s domiciled in Germany, that’s down nearly 20%.
So in our view, it is a dangerous thing when a small handful of companies come to dominate the broader indexes because, once those stocks reverse, you know, the larger averages, the broader stock market really has no choice but to decline. So we’re watching these five stocks closely. I’ll show you what’s going on there.
The other thing I want to point out is a chart showing what I see as a fairly extreme level of complacency in the UK. What I did is, I just plotted a financial stress index against a gauge of volatility.
And because these two charts ebb and flow in opposite directions, the times of panic, right, the bottoms in the market really show up as a narrowing of these two graphs in the periods of complacency, right? The tops in the market show up as a widening of these graphs.
And it’s kind of funny because every year in January, we read all these reports about how pessimistic investors have become because British shares have really been under-performing for years now. If that were true, it would be, it would definitely be a good reason to be bullish on the market. I just don’t think it is true. It’s quite the opposite, actually. We’re clearly not near any kind of pessimistic low point.
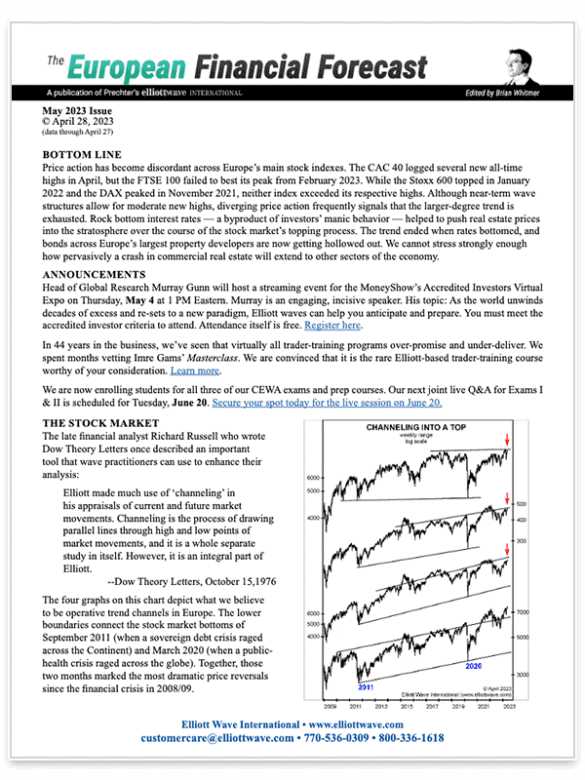
So those are the only two charts I want to highlight. Beyond that, I talk a lot about credit markets and the economy this month. The property markets have frankly gone from bad to worse, and I’ve got some charts and discussion on what I think the impacts will be there.
So enjoy the letter, and I will see you again soon.
So, this is the new year. Ready?
Whether you own tech stocks; trade FX or cryptos; wondering if gold is a “buy”; biting your nails about interest rates because you need to borrow or refinance – our Global Market Perspective has got you covered.
See what Elliott waves show for 50+ of the world’s biggest markets in our new Global Market Perspective.
Invest only in Europe? The European Financial Forecast is your ticket to get in front of trends in the region’s top markets.
European
Financial Forecast
$37
At the beginning of each month, you get a 30-60 day look ahead at the markets. With insightful charts and text, this publication lays out expected trends and turns in this region.
Coverage includes the DAX, FTSE 100 and 200, CAC-40, AEX, SMI, IBEX 35, S&P/MIB, Dow Jones Euro Stoxx 50, RTS, CECE Overall Traded Index, Euro and other featured markets across Europe.
Global Market
Perspective

$77
Gives you clear and actionable analysis and forecasts for the world’s major financial markets.
Get insights for the U.S., European and Asian-Pacific main stock indexes, precious metals, forex pairs, cryptos (including Bitcoin), global interest rates, energy markets, cultural trends and more.