Elliott Wave International Master Theme.
-
Musical (Fed) Chairs
Who will be the new Fed chair? Names are already being floated in the nation’s capital. But does it matter who heads the Fed as far as the trend of interest rates goes? You might be surprised.
-

Increasingly Authoritarian—and Anti-authoritarian—Impulses
The White House deployment of the National Guard to intervene in L.A. protests has shocked many. But we see it as a powerful sign of negative social mood.
-

Debt Ceiling Drama
Borrowing and more borrowing. That’s the story of the U.S. government. And, now, Congress wants to raise the “debt ceiling” – again. Here’s what you need to know.
-
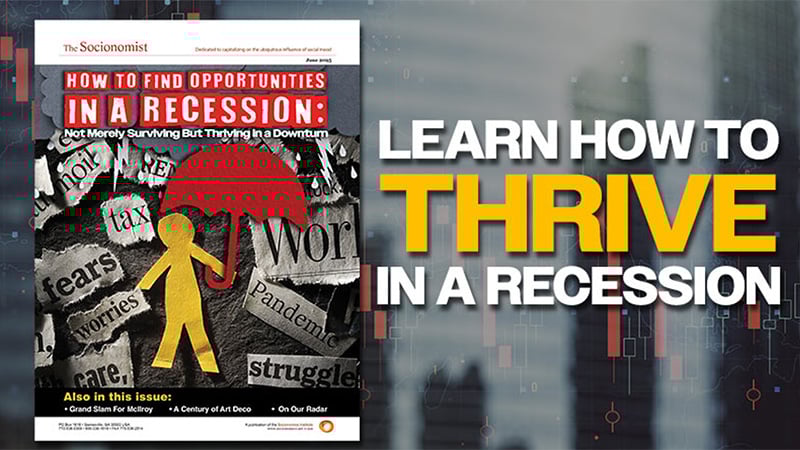
You CAN Survive a Recession – You may Even THRIVE
The mainstream view of the future of the U.S. economy is short on hope. But we see many opportunities to thrive.
-
Is U.S. Government Debt Risk Free? (Video)
Has U.S. government debt really stopped being “risk-free”? EWI’s Murray Gunn explains why he “doesn’t rule anything out.”
-

Fundamentals Lag Stocks
Stocks move ahead of fundamentals, which is why Europe’s major defense stock have exploded upward over the past 4 years. EWI’s Brian Whitmer asks, “So … why do pundits say these shares are a buy?”
-

Long Term Trend Change in China’s Yuan
China’s Yuan currency recently saw a major, long-term trend change. See the chart for yourself, and how it implies a major opportunity.
-

Ukraine’s “Spider Web” Drone Assault on Russia
The Ukraine drone attack on Russia “caught military strategists off-guard.” But social mood has created the ideal conditions for Operation “Spiderweb.”
-

Why Do People Buy Shoes at a Discount But Not Stocks?
People’s search for bargains in stores is different from their bargain search in the stock market. Get insights into this striking fact.
-

Contrary Indicators, Elliott Wave Patterns, and The Dollar Index
What happens when a financial trend is strong enough to make the cover of a major news magazine? Read (and see) the answer for yourself.
Got any book recommendations?