Gasoline prices have gone from “state-of-emergency” highs to one-year lows. Market psychology (expressed in Elliott waves) or easing inflation? These charts give you true answers.
There are many reasons technical market analysts like us don’t rely on “market fundamentals” to gauge trends. One such reason is this: The metrics many mainstream experts rely on to make their forecasts are calculated weeks or months before they make the forecasts.
Let me explain.
Take the recent news surrounding unleaded gasoline prices (RBOB, as it’s known to energy market speculators and producers). In mid-September, RBOB clung stubbornly to monthly highs as a rising energy sector tide lifted most markets, from gasoline to natural gas to heating oil. And Wall Street placed a lot of emphasis on one “fundamental” factor to explain high energy costs: the Consumer Price Index (CPI), a key inflation gauge.
Sure, gas prices (and energy as a whole) make up a large chunk of the CPI pie. But the CPI figure released today reflects the performance of its component parts (including gas) from a month earlier. It’s not “today’s” data. Yet, economists routinely use it to forecast tomorrow’s prices — and are often coming up short.
To wit: On September 13, the Bureau of Labor Statistics announced the CPI figure for… August. It was the biggest inflation jump in 14 months.
That should have translated into soaring gas prices in August, right?
Well, RBOB trended up-down-sideways in August.
Again, on October 12, the CPI figure for September was revealed. Another 3.7% gain, again above analysts’ expectations. Gas prices in September should have jumped, right? Yet, they went up only in the first half of September, to turn precipitously lower by mid-month.
In other words, it’s hard to glean the future of gas prices via past inflation figures. The CPI can only show you what happened a month earlier. It doesn’t show you what inflation is doing today, and it certainly doesn’t say what inflation will do tomorrow. Yet again, that’s what economists use as a forecasting tool!
The reason we prefer Elliott wave analysis as our forecasting method is because it goes directly to the market psychology patterns unfolding on price charts.
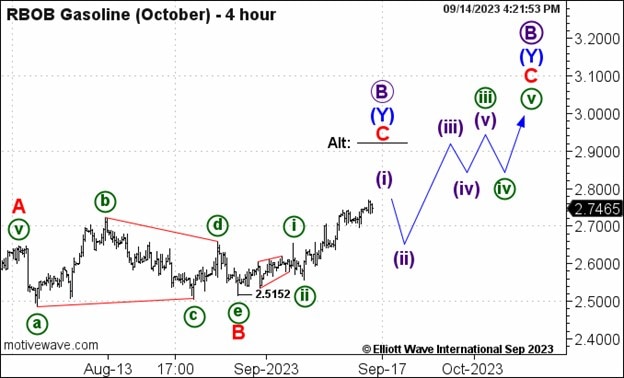
On September 14 — right before gasoline prices made their bearish mid-month U-turn — our Energy Pro Service showed this RBOB chart. The larger-degree Elliott wave count called for more rally. A shorter-term wave count suggested that the wave (i) rally was close to done. Even more bearishly, another probability was that the large-degree wave B top was in place. Energy Pro Service citied a critical resistance level prices had to remain above to keep the trend up. If 2.69 was broken to the downside, the bearish wave forecasts would kick in:
“Trade below Wednesday’s 2.6959 low would suggest that a top of some magnitude is in place.”
From there, gas prices indeed fell. On September 15, Energy Pro Service wrote:
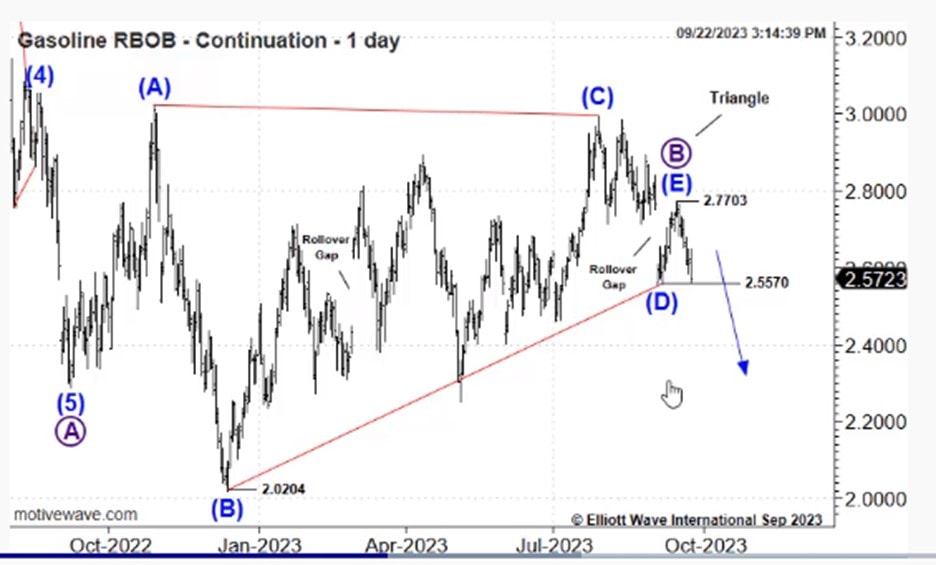
“Unleaded drifted a touch lower which suggests that last week’s 2.7703 high marks a top… Trade below 2.5570 would favor a bearish interpretation (i.e., Primary wave ((B)) complete).”
Bearish confirmation occurred days later, and on September 22, Energy Pro Service set the stage for much further decline in wave C down, writing:
“If October has peaked then we should come on down and do so in an impulsive manner.”
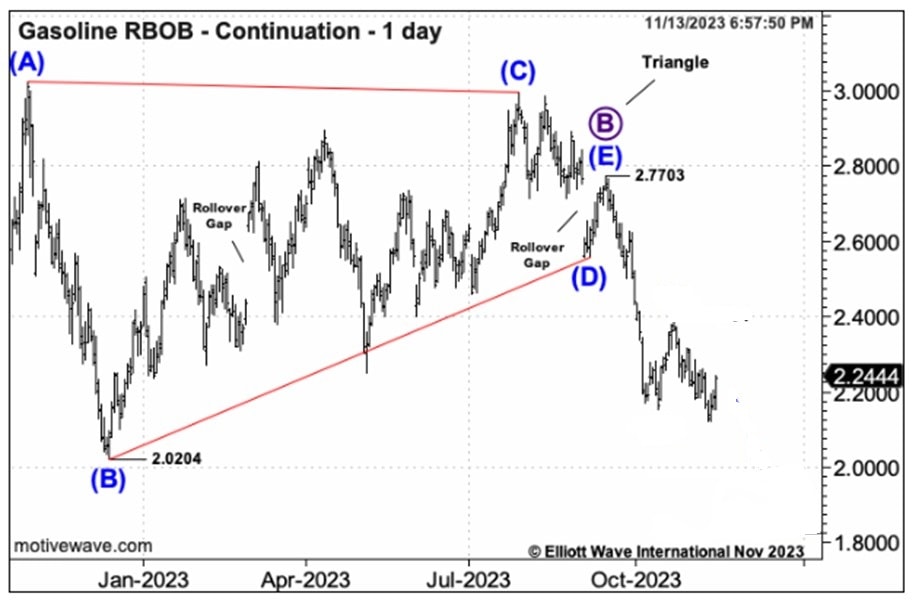
This final chart captures the extent of RBOB’s multi-month selloff, bringing its price to a 1-year low. Not surprisingly, when October’s CPI figure was released on November 14, it was “lower-than-expected.”
Before you throw away all your current forecasting tools, know that Elliott wave analysis isn’t perfect. It deals with probabilities, not certainties. And the wave pattern isn’t always clear until price action confirms it.
But unlike “fundamental” analysis, which focuses on stale data, Elliott wave analysis looks at the current, up-to-the-minute patterns of investor psychology as it unfolds in real time. In our experiences, that’s a huge advantage when trying to find the right path as major turns develop.
Energy Opportunities on Every Time Frame
For active traders watching the intraday, daily and weekly price movements in the energy markets, our Energy Pro Service presents detailed analysis that focus on meaningful developments underway in crude oil, natural gas, heating oil, unleaded and more.
Energy Pro Service helps you to shift from simply following market trends to predicting their objective paths of least resistance (and risk).